How Voice Rater Works
The complete signal chain, the thresholds behind every sub-score, and the one measurement I had wrong for weeks without noticing.
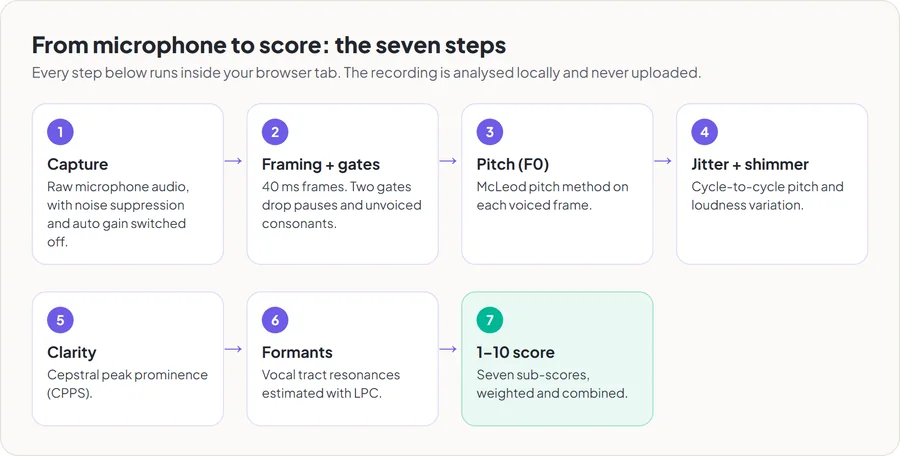
Voice Rater runs every calculation inside your browser tab. No audio is uploaded, and there is no backend that could receive it if there were. This page documents what happens between pressing record and seeing a number, because a score you cannot audit is worth about as much as a random one.
None of this is novel signal processing. Every technique here is standard in speech science, and the reference implementation everyone uses is Praat. What is unusual is doing it client-side: the normal way to build this is to send a WAV file to a server running Praat, which means hosting costs, a queue, and the user handing over a recording of their own voice. The whole exercise here was seeing how far the Web Audio API gets on its own.
1. Capturing the audio
Three getUserMedia constraints have to be switched off, and this is the single most common way to get meaningless results:
- noiseSuppression removes the low-level aperiodic energy the voice quality measurement reads, and the silent-frame noise floor section 5 needs. Leave it on and every voice looks clean.
- autoGainControl flattens the amplitude contour, which destroys shimmer. Leave it on and the shimmer figure describes the AGC time constant instead of the speaker.
- echoCancellation applies adaptive filtering that can alter the spectrum in ways that shift formant estimates.
PCM is collected through a ScriptProcessorNode. That node is deprecated and AudioWorklet is the modern replacement, but it proved unreliable on several iOS versions, and ScriptProcessorNode remains the only method returning continuous non-overlapping frames everywhere. One catch: in some browsers the callback is never scheduled unless the node is connected to the destination, so it is routed through a gain node set to zero. Connected, but silent.
The sample rate is whatever the device reports. Nothing in the chain assumes 44.1 kHz.
2. Framing and the two gates
The recording is cut into 40 ms frames with a 20 ms hop. Forty milliseconds is a compromise: it holds at least two complete periods even for a 60 Hz bass voice, which autocorrelation needs, while staying short enough that the vocal tract has not visibly changed shape within the frame.
Two gates then discard frames that would poison the statistics:
| Gate | Threshold | Why |
|---|---|---|
| Loudness | −45 dBFS | Room tone and breath between words would otherwise be analysed as if they were voice |
| Periodicity | NSDF peak < 0.55 | Unvoiced consonants (s, f, sh) have no fundamental frequency to measure |
The proportion of frames that survive the second gate becomes the delivery flow sub-score. A take that is mostly breath and pauses genuinely scores lower there, which is the intended behaviour. Frames rejected by the loudness gate are not thrown away: a pause holds your microphone and your room and nothing else, which is what section 5 measures.
3. Fundamental frequency: the McLeod method
F0 comes from the normalised square difference function, the core of the McLeod pitch method, searched between 60 and 500 Hz. Plain autocorrelation was the first thing tried and it fails the same way it always fails: it happily locks onto the octave below, because a signal correlates strongly with itself at twice its period. Normalising by the frame energy at each lag, then taking the first sufficiently strong local maximum rather than the global one, mostly removes that failure mode.
Two details matter more than they look:
- DC removal before correlating. Many microphones carry a DC offset, and it lifts the whole correlation curve, which flattens the peaks you are trying to distinguish.
- Parabolic interpolation on the peak. Integer lags give terrible resolution in the upper register: at 400 Hz on a 44.1 kHz signal, adjacent lags are about 15 Hz apart. Fitting a parabola through the peak and its two neighbours recovers sub-sample precision. Measured error against synthesised tones across 85–300 Hz is about 0.3%.
4. Jitter and shimmer: two mistakes worth reading
This is the part I got wrong twice. The first error is, I suspect, why other browser-based voice tools feel like they return random numbers.
The obvious implementation, once you already have a per-frame F0 track, is to measure how much F0 varies from frame to frame and call that jitter. It is wrong by an order of magnitude. A 40 ms frame contains five or six glottal cycles, and the autocorrelation has already averaged across all of them. The perturbation you are trying to measure is the thing the estimator smoothed away before you saw it.
Concretely: that version reported around 0.09% where the true figure was closer to 1%. Every voice scored full marks on stability, and a deliberately hoarse recording came out ahead of a clean one.
The correct approach is the textbook clinical definition, in the time domain, cycle by cycle:
- From F0, derive the expected period
T0 = fs / f0, then smooth the waveform with a moving average about T0 / 8 long. Without it, harmonic ripple offers competing maxima inside one period and the tracker hops between them: a synthetic vowel with exactly zero jitter measured 7.1%, and injecting 1% moved it to 7.09%. - Walk the smoothed waveform, and at each predicted cycle position search a window of
±30% of T0for the actual amplitude peak. It must be wide enough to track a drifting period and narrow enough not to jump a whole cycle. Fit a parabola through that peak to place it between samples: integer quantisation alone contributes about 0.3% of false jitter at a 320-sample period, the size of the 0.4% being measured. - Record every peak position and amplitude, then step forward one
T0from the peak just found, not from the prediction, so the tracker follows drift instead of accumulating error. - Jitter is the mean absolute difference between adjacent periods, as a percentage of the mean period.
- Shimmer is the mean absolute difference between adjacent peak amplitudes, in decibels.
At least five detected cycles are required, and only on locally steady ground: an 80 ms window is placed where consecutive frames agree on F0 to within 3%, hunting inside a sentence for stretches that behave like a sustained vowel. Across eleven people reading aloud, jitter comes out 2.5% to 8.2% and shimmer 1.0 to 2.4 dB, far larger than a clinic would quote. Which is the second mistake. Clinical thresholds assume a sustained vowel, but intonation, stress and word transitions move the fundamental on purpose, so a cycle-by-cycle comparison counts every deliberate movement as perturbation. With 1% as the healthy boundary, every one of them scored in the fours and fives on a page promising the sevens, while a synthetic tone scored 7.2.
5. Voice quality: cepstral peak prominence
What replaced those thresholds is smoothed cepstral peak prominence, which speech pathology adopted for this situation: it asks how closely the spectrum resembles a clean harmonic comb, a question intonation does not disturb. Each frame gets a log power spectrum, then a second FFT turning it into a cepstrum, then a peak search across the quefrency band matching the 60 to 500 Hz pitch range. Peak height above a least-squares regression line through the same band is the prominence, smoothed across five neighbouring frames and eleven quefrency bins; the median over the take is reported. It runs on a 16 kHz downsampled copy in 40 ms frames with a 25 ms hop, which costs 0.05 dB and takes under half a second instead of nearly three.
Absolute values are not portable between implementations, so the literature's boundary is the wrong number to copy. Calibration uses this implementation's own readings, listed in section 7: full marks at 9.5 dB, zero at 3.2 dB. Noise is the complication. A raised floor buries harmonic structure and pulls the prominence down about 3.2 dB between a clean recording and one at 10 dB signal-to-noise, reading as a rougher voice, so the score compensates. That means knowing how clean the recording is, and the old harmonic-to-noise ratio cannot say: on connected speech it barely moves between speakers, pinning the cleanliness figure near 10% for everyone and switching the compensation off in practice. What replaced it is a true signal-to-noise ratio, the median level of the voiced frames over the median level of the frames below the loudness gate, where twelve decibels counts as dirty and thirty-four as clean. With no pauses at all, as happened twice, the quietest tenth of all frames stands in.
A side-by-side measurement of three human readings and one synthetic test tone, and the calibration mistake that synthetic signals led to, is in real voices vs synthetic tones.
6. Formants via LPC
F1 and F2 come from a 16th-order linear prediction filter solved with Levinson-Durbin recursion, on a copy of the signal downsampled to 11,025 Hz. The downsampling is the important choice: formants of interest all sit below about 5 kHz, and running a 16-pole model against a 24 kHz band spends most of its poles describing high-frequency content that carries no formant information at all.
The classic way to extract formants from LPC coefficients is to find the roots of the prediction polynomial. That is mathematically cleaner and numerically fragile: root finding on a 16th-order polynomial in JavaScript, on arbitrary consumer microphone input, produces occasional nonsense. Instead the LPC spectral envelope is evaluated on a frequency grid and scanned for local maxima. Less elegant, considerably more stable, and the resolution is more than sufficient when the goal is telling F1 around 500 Hz from F1 around 700 Hz.
Formants are the second line of evidence for the masculine-feminine read-out. Pitch alone gets it wrong in the cases people care about most: a man in falsetto and a woman with a low speaking voice can share an F0, but their vocal tract resonances usually differ, because resonance depends on tract length, which vocal fold frequency does not change.
7. From measurements to a 1–10 score
Seven sub-scores, each normalised to 0–1 and weighted, the weights differing between speaking and singing. Range counts for 6% when you talk and 20% when you sing, because a monotone speaking voice is normal and a monotone singing voice is not. Clarity carries the most weight in both, 32% speaking and 26% singing, being the sub-score that tracks the voice and not the performance.
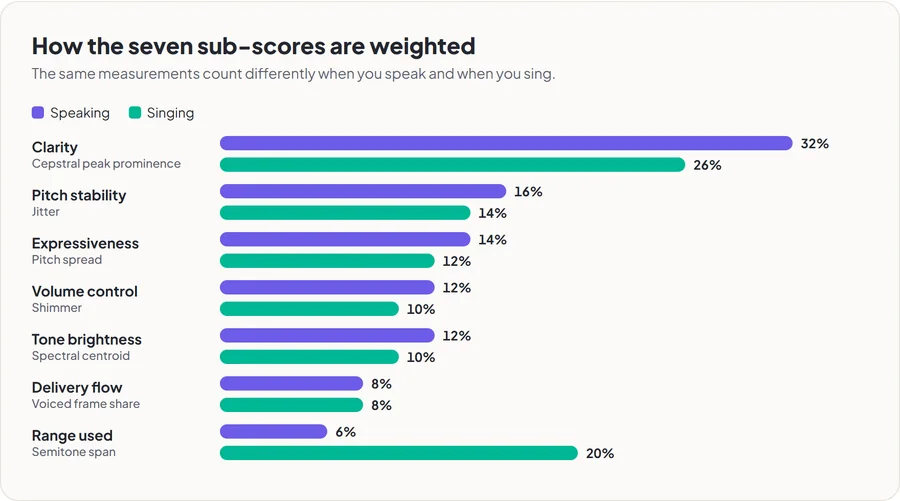
| Sub-score | Measured from | Full marks at | Zero at | Speaking weight |
|---|---|---|---|---|
| Clarity | Cepstral peak prominence | 9.5 dB | 3.2 dB | 32% |
| Pitch stability | Jitter | 2.0% | 7.0% | 16% |
| Volume control | Shimmer | 0.8 dB | 2.8 dB | 12% |
| Expressiveness | Pitch spread | 3.2 semitones | far from target | 14% |
| Tone brightness | Spectral centroid | 1900 Hz | far from target | 12% |
| Delivery flow | Voiced frame share | 80% | 15% | 8% |
| Range | Semitone span | 10 semitones | 1 semitone | 6% |
Two of these are band scores with a sweet spot: expressiveness and tone brightness both peak at a target and fall away in either direction. A completely flat pitch contour reads as reciting; an enormous one reads as unsteady, and earns no expressiveness credit for its size.
Why the full-marks end is set at professional level
The first calibration set each threshold at a healthy-voice pass mark and lifted the curve with a 0.62 exponent. That crowded trained and ordinary voices alike into the top of the scale: an average person scored 9.0, a disordered voice still managed 5.0, and the result is indistinguishable from not measuring.
The fix was to move the full-marks end up to professional standard and raise the exponent to 0.9. A purely linear mapping was tried too, and it pushes healthy voices into the low sixes, which reads as an insult.
The exponent survived the September rewrite. The clinical thresholds it was paired with did not:
| Measured on connected speech | Reading |
|---|---|
| CPPS, healthy adults reading aloud (our tests) | 6.7 – 7.0 dB |
| CPPS, low-quality recording | 3.1 dB |
| CPPS, synthetic voice | 6.8 dB |
| Jitter, eleven readers | 2.5 – 8.2% |
| Shimmer, eleven readers | 1.0 – 2.4 dB |
| Harmonic-to-noise ratio, eleven readers | 4.6 – 9.5 dB |
| Old total score, eleven readers | 4.1 – 5.8 |
That table forced the rebuild: clarity moved onto cepstral peak prominence, jitter and shimmer were rescaled, both losing weight. The lesson for anyone calibrating something similar: constructed metric objects fed to the scoring function only prove the curve behaves. Synthetic audio proves less: perfectly periodic, it outscored every human in the set.
8. Pitch accuracy: a separate measurement
Everything above scores how a voice behaves. It cannot say whether you sang the right note, because it has no idea what note you were aiming for. The pitch accuracy test on the Rate My Singing page closes that gap by supplying the target itself: five reference notes play, you sing them back, and each one is compared against a known frequency.
The detector is the same McLeod implementation from section 3. What differs is everything around it.
The reference plays before recording, never during. Sung-along reference tones leak into the microphone, and the detector has no way to tell which of the two fundamentals belongs to the singer. Playing first and recording after costs six extra seconds and removes the ambiguity entirely.
Only the middle half of each note is measured. A note is held for 1.2 seconds, and the window from 25% to 75% is what gets analysed. Sliding up to pitch at the start and tapering off at the end are normal singing behaviours. Including them would penalise the technique that makes singing sound musical. The frames inside the window are reduced to their median, so a single mistracked frame cannot drag the result.
Deviation is reported in cents, and octaves are normalised away. The error is 1200 × log₂(sung / target), wrapped into ±600 cents. Without that wrapping, a bass following the higher reference range would be marked 1200 cents wrong on every note, when singing the pattern an octave down is musically correct and deserves full marks. The test compares pitch class, and the octave a note is sung in has no effect on the result.
The score curve has its inflection points set to the same thresholds used for the per-note verdicts, so the total and the individual labels cannot contradict each other:
| Average deviation | Verdict | Score |
|---|---|---|
| ≤ 15 cents | Spot on | 9.2 – 10 |
| 15 – 30 cents | Close | 7.5 – 9.2 |
| 30 – 50 cents | Slightly off | 5 – 7.5 |
| > 50 cents | Off | below 5 |
Fifteen cents is roughly where the error stops being audible to most listeners, and fifty is half a semitone. A note that fails the three-frame minimum is reported as not heard and scores nothing. Quietly dropping it would let someone sing one note correctly, hum through the rest, and get a perfect result.
One systematic effect is separated out from the average: if all five deviations lean the same way, the test says so. A consistent lean is usually mechanical, and fixable. Flat throughout often traces to breath support, sharp to pushing. Errors scattered either side of the target point at ear training instead. Keeping the sign on each deviation before averaging is what makes that distinction visible.
9. Reading the results in context
Being specific about the limits is part of the method, and belongs here as much as the thresholds do.
- It is not a clinical measurement. The parameters are the ones voice clinics use, but there they come from calibrated equipment, on a sustained vowel, interpreted alongside a physical examination. A short phrase through a laptop microphone is not that, and should never be read as a health result. Persistent hoarseness beyond two or three weeks is a reason to see a doctor.
- Your room and microphone are in the number. Cepstral peak prominence falls by about 3.2 dB between a clean recording and a noisy one, which is why the measured signal-to-noise ratio corrects it. Correction narrows the gap without closing it, so comparing scores across two rooms still partly compares the rooms.
- It cannot judge whether a voice is pleasant. That is a listener response shaped by accent, familiarity and context. No acoustic parameter measures it, and any tool claiming otherwise is guessing.
- Voice age is an estimate from voice quality and pitch, and a biological age cannot be read from a recording. Cepstral peak prominence is the main channel, mapped so 7.2 dB reads as 26 and 3.0 dB as 51; roughness from jitter and shimmer supplies a quarter of the quality estimate, pitch 30% of the total. Output is capped at 56, quoted as a nine-year band.
- The gender read-out is a position on a continuum, derived from F0 and formants. It describes acoustics only, and says nothing about identity.
- The pitch accuracy test measures five sustained notes and nothing more. Real intonation drifts with breath, register changes and interval size. A good score means your ear and voice agree on a simple target. Whether a whole song will hold together is a separate question.
10. Checking any of this yourself
Every result page has a raw measurements panel showing your F0, cepstral peak prominence, jitter, shimmer, harmonic-to-noise ratio, spectral centroid, F1, F2 and voiced-frame share behind your score, so you can see which measurement drove the result.
The analysis code is a single unminified JavaScript file served from this site. Open the developer tools network tab and read voice.js. The functions above appear in the same order as this page. The privacy claim is checkable there too: watch the network tab while recording and analysing. Nothing is sent, because there is nowhere to send it.
Try it against your own voice. Five seconds, no account, and every number above is shown to you.
Rate your voice free